How you trade
Use the numbers from your trading journal, not the ones you hope for.
More about how you trade
More tools: fill in from your trades, risk in contracts
Fill these in from your trades
Your risk in contracts
Example numbers are filled in. Put in your own.

Your average trade
Your top plan's eval, taken 100 times
What this shows: we pretend you buy this plan's eval (the challenge you pay for to get funded) 100 times and trade each one with your numbers for up to 30 trading days. Each dot is one eval. Gold means you passed, red means you blew the account, gray means the eval's days ran out. The lines on the left are a few of those evals, so you can watch how they go up and down along the way.

Share your results
Makes a picture of your top 3 plans (the first 3 rows in the list below) with your numbers. Press and hold it (or right-click) to save it, then post it.
What this is: a simulation of your own numbers through each plan's rules. Two-step and three-step plans must pass each step in turn, each on a fresh balance, inside your days. Each trade wins your average win or loses your risk, at your win rate. A run passes when profit reaches the target (after the minimum days and the consistency rule), blows the account when it touches the drawdown line, and runs out of time otherwise. The range shows the same plan if your win rate were 5 points lower. Same seed every time, so the same inputs give the same answer.
Grouped plans: when two plans have the same target, max loss, daily limit, drawdown type, consistency, minimum days and time limit, they pass just as often, so they share one row. The cheapest one leads, and the others are listed under it. Their payout rules, prices and bans can still differ.
What it leaves out: losing streaks that bunch together, slippage, fees, news bans and contract limits. Daily loss limits stop trading for the day, except where the firm says a hit fails the account (most CFD plans): there it counts as a blown account. In trade replay, an open trade's worst point counts toward the daily limit, the way most CFD firms count floating losses. CFD trading days run 5 PM to 5 PM New York time. It compares plans for you; it is not a forecast and not any firm's pass rate.
Get paid back: after a pass, we play a fresh funded account with the same drawdown and daily limit. It counts when you reach the firm's fewest days to a first payout with enough profit for your share to cover what you paid (or the firm's minimum payout, if higher). Winning-day rules, buffers and payout caps are not in yet, so treat this as rough.
Losing streak: we play 100 trades at your win rate 2,000 times and take the middle longest run of losses. Plans where that streak would use 60% or more of the max loss get a warning.
Contract limits: the contracts box (under More tools) is checked against each plan's limit from its rules. Where a firm states only one number, we check that number only.
Best size: we replay the plan at a quarter, half, three quarters, the same, 1.25x, 1.5x and double your risk, keeping your win rate and profit factor. The best size is the one with the highest pass chance in your days. The top 10 rows show it in the list; open any row for the full table and the days chart.
Prices: today's best live code first, the full price and what the code took off underneath. "Cost at your pass rate" is the first purchase, plus the firm's own reset price for each extra try you'd likely need (or a rebuy at today's code price when that is cheaper, when the firm has no reset, or when we haven't found its price), plus the activation fee once. Monthly plans are billed every 21 trading days for as long as your tries would take, plus a reset fee per extra try unless a failed account resets free when it renews. Reset prices were read from each firm's own pages on Nov 19. Nothing you type leaves your device.
Replay my real trades: upload a trade export and we replay your actual trades, in order, through each plan. A fresh eval starts on every trading day in your file. Futures days follow the CME session, which rolls at 6 PM New York time. Perps trade around the clock, so a perps day runs midnight to midnight UTC, the way most perps firms reset their daily loss limit. When the file has each trade's worst and best point (MAE and MFE), we use them, so a trade that dipped near the drawdown line counts even if it closed green. The likely range is a 95% range based on how many back-to-back evals fit in your file. Under 20 trading days or under 5 back-to-back evals, a plan is marked "Not enough trades yet".
Pass chances are your numbers run through each plan's rules, not a firm's pass rate and not a promise. "Get paid back" is before payout caps. This isn't financial advice.
Watch: how long it takes to pass a prop firm challenge
How to read your results
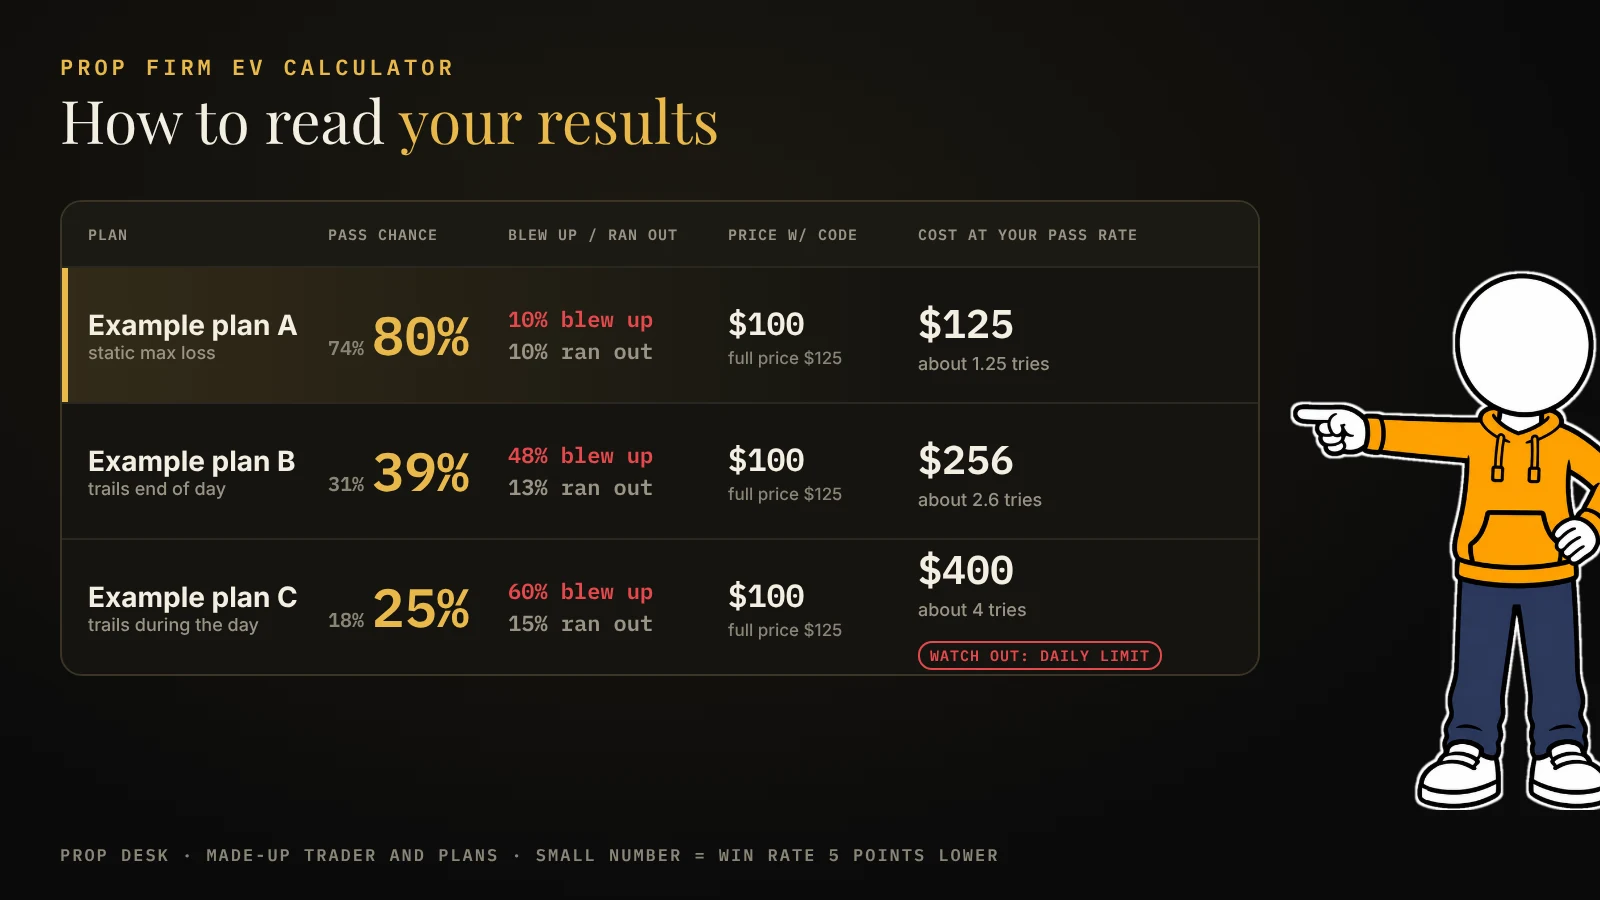
Each row is one plan. Rows are sorted so the plan you're most likely to pass is at the top.
- Pass chance. We play your numbers through that plan's real rules 1,000 times. The big number is how many of those passed. The small number in front is the same thing with a win rate 5 points lower, in case your journal is a little kind to you.
- Blew up and ran out. "Blew up" means the account hit the max loss line. "Ran out" means the days ran out before you hit the target.
- Get paid back. After a pass, we play the funded account too. This is how often you'd reach a first payout that covers what you paid. It's a rough guess that leaves out payout caps and buffers.
- Price with code. Today's price with the best live code. The full price and what the code took off are underneath.
- Cost at your pass rate. If you pass 1 in 2 tries, getting funded costs about 2 prices, not 1. This column does that math for you.
- Watch out. Rules that clash with how you trade, like a losing streak that eats most of the max loss, or a consistency rule.
To test one plan in more detail, use the pass-odds simulator. The chart above the list plays your top plan's eval up to 100 times. Each dot is one eval: gold passed, red blew the account, gray ran out of days.
How long does it take to pass a prop firm challenge?
For a trader whose average trade makes money, it usually takes a few weeks of trading days. The exact time depends on three things: what your average trade is worth, how many trades you take a day, and how big you trade.
Take a made-up trader: a 50% win rate, a profit factor of 1.5, $200 a trade, 3 trades a day, on a 50K plan with a $3,000 target. The middle run passes in about 15 trading days. Doubling to $400 a trade gets the middle pass down to about 6 days, but the blow-ups triple, from about 10% to about 30%.
Fewer trades means more days. The same trader taking only 1 trade a day passes only about 21% of the time within 30 days, but about 61% of the time when given 60 days. So before you buy, check whether the plan has a time limit. Then set the days box in the calculator to match.
How many tries does it take to pass a prop firm challenge?
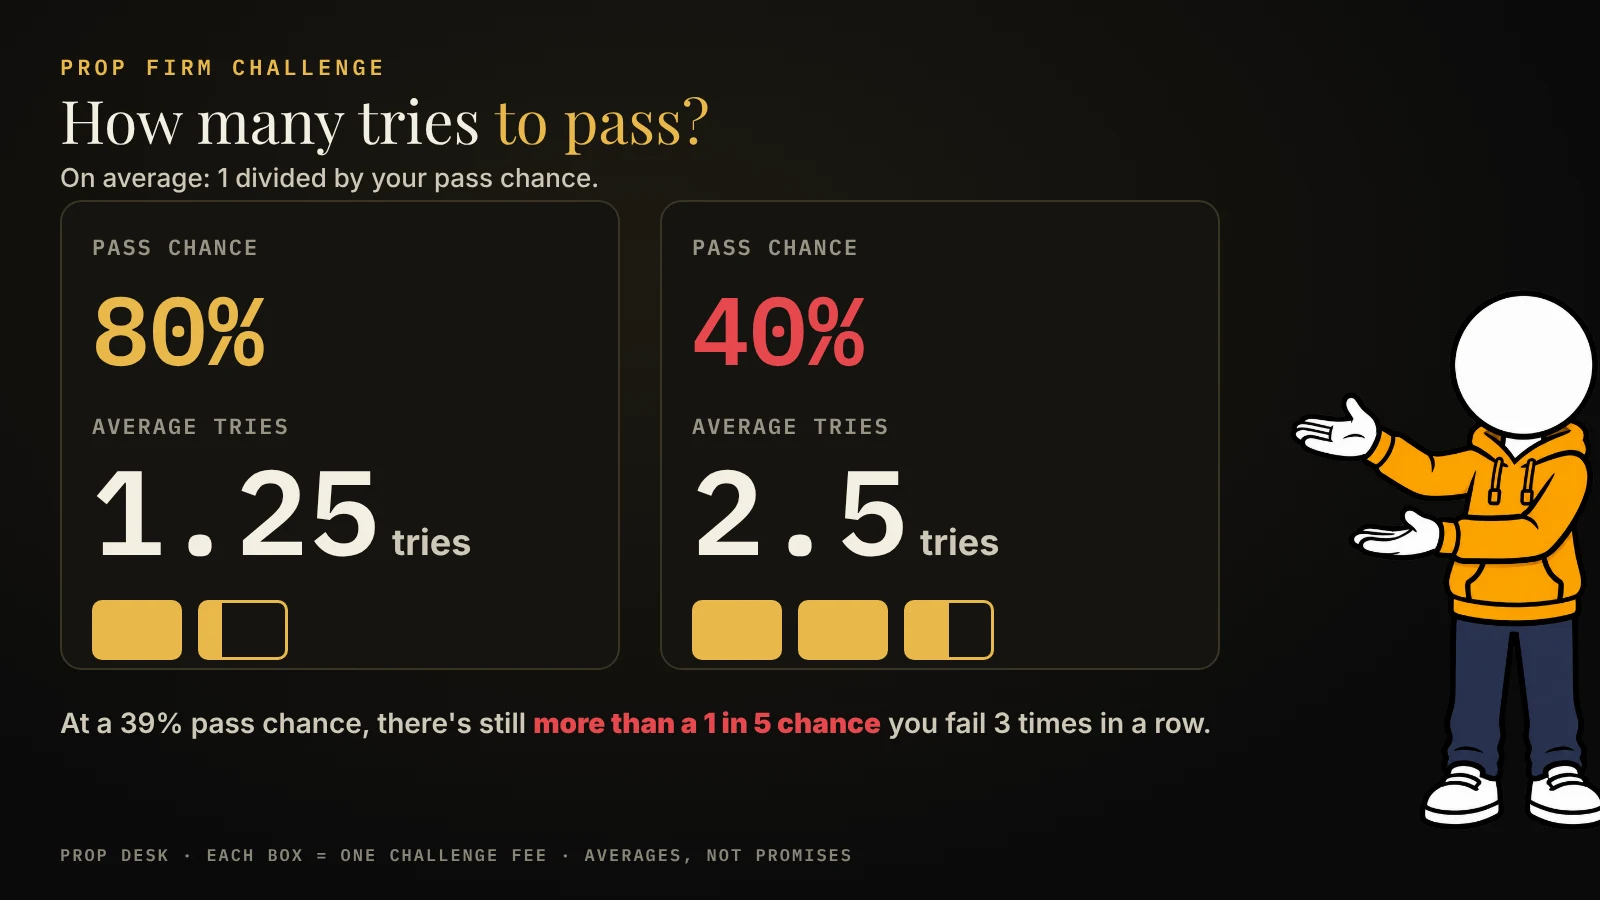
On average, about 1 divided by your pass chance. At an 80% pass chance, most traders pass on the first try, so it takes about 1.25 tries on average. At a 40% pass chance, it's about 2.5 tries.
Tries add up fast. At a 39% pass chance, there's still more than a 1 in 5 chance you fail 3 times in a row. That's why the list shows "cost at your pass rate": it's the price times the tries you'd likely need.
How to pass a prop firm challenge: what most traders miss
Most traders shop by price and profit target. What decides whether you pass is how your numbers meet the plan's rules. Here are the things people most often don't check.
Profit factor matters more than most traders think
Take the made-up trader again. With a profit factor of 1.5 they pass about 80% of the time. Drop it to 1.2, with the same 50% win rate, and the pass chance falls to about 39%. Making your winners a little bigger does more than winning a little more often.
Trailing drawdown explained: why it's harder than a static one
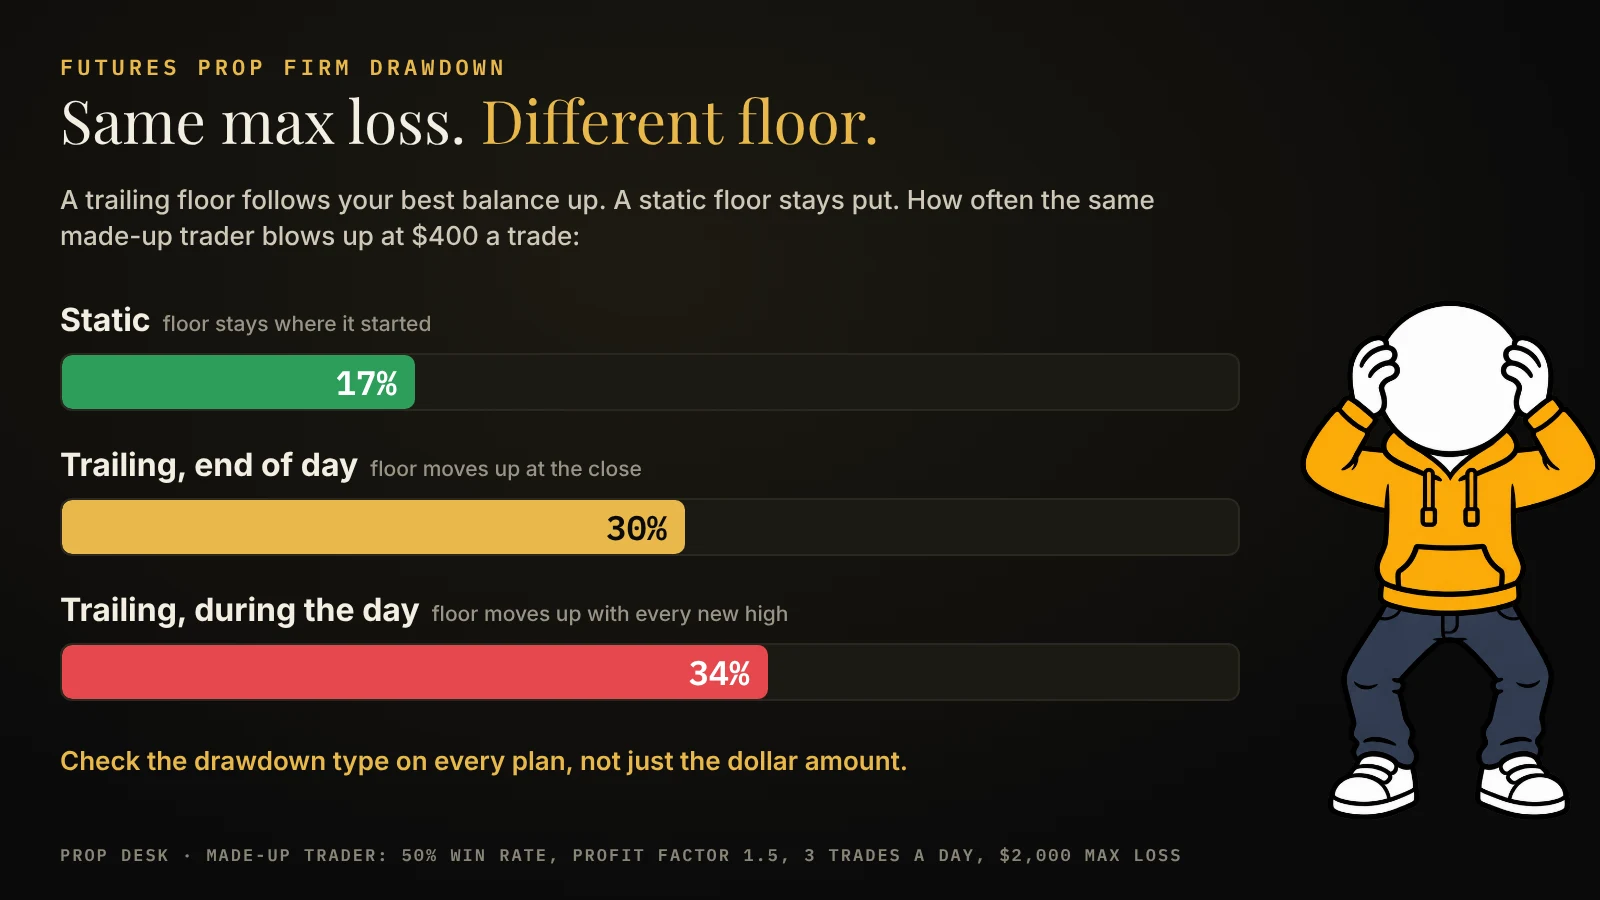
A trailing drawdown follows your best balance up, so every winning day raises the floor under you. A static drawdown stays where it started. At $400 a trade, our trader blows up about 17% of the time with a static max loss, about 30% when it trails the end-of-day balance, and about 34% when it trails during the day. Check the drawdown type on every plan, because the same dollar amount can be much tighter.
Your losing streak decides your size, not your average day
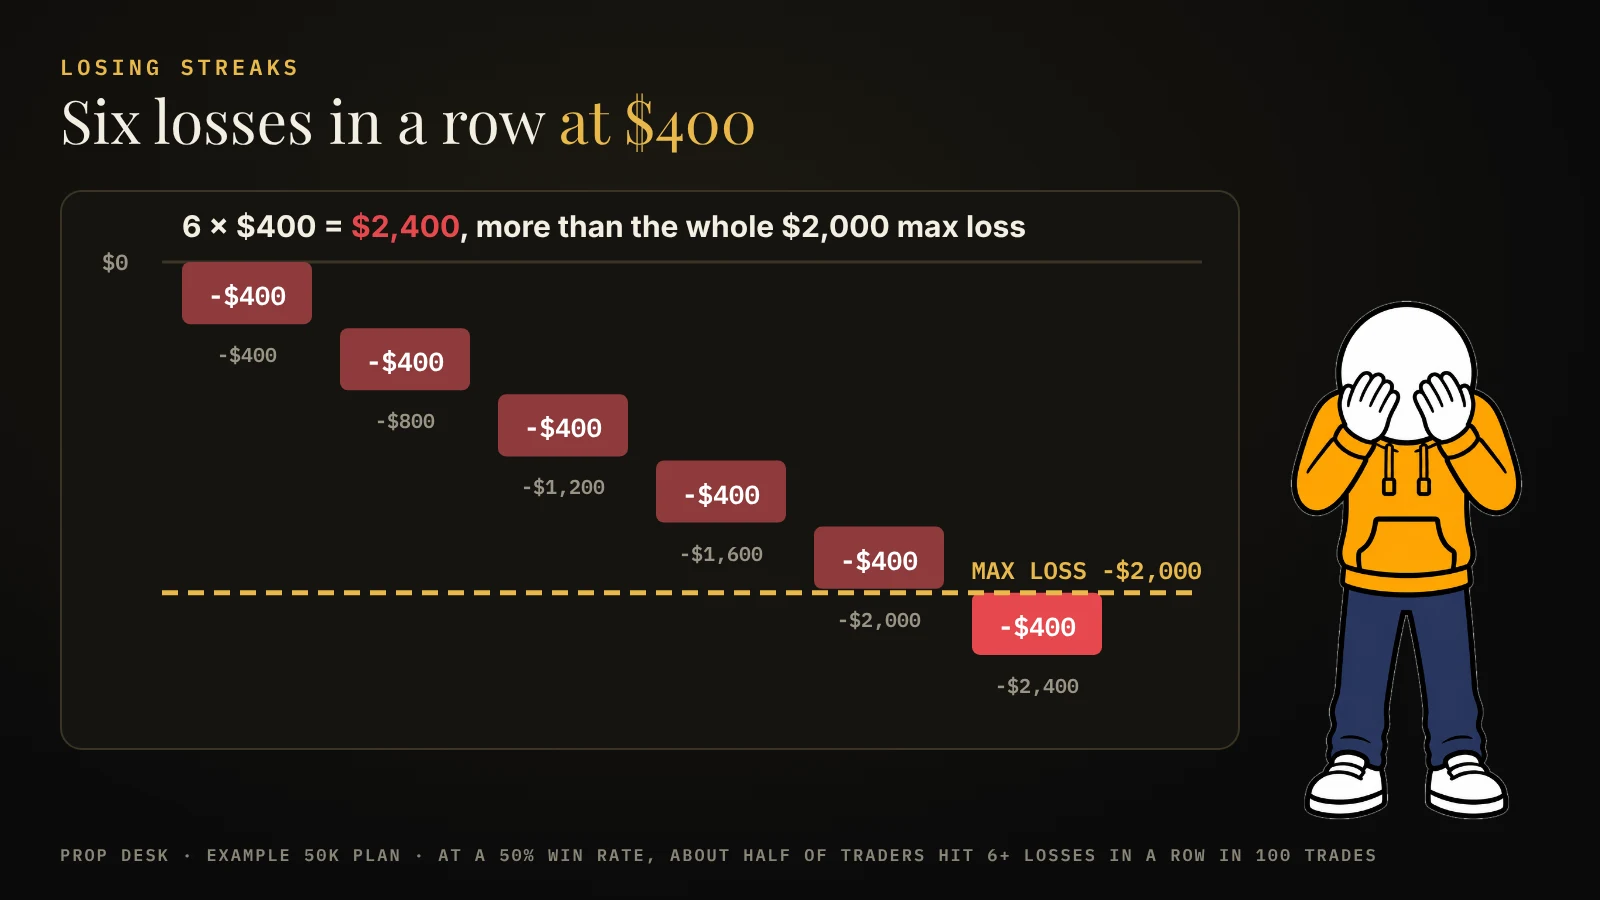
Losing streaks are normal. At a 50% win rate, about half of traders hit 6 or more losses in a row within 100 trades. Pick a risk size that survives your likely streak with room to spare. The calculator shows your streak and how much of each plan's max loss it would eat.
Passing fast doesn't matter, not blowing up does
Doubling the size gets the middle pass from about 15 days down to about 6, but the blow-ups triple. Most plans have no prize for speed. A slower pass at your normal size is usually the cheaper one.
The daily loss limit is about your size
If one loss is half the daily limit, two losses in a row end your day. At some firms, hitting the daily limit ends the whole account, not just the day, so read the plan's rules. The "watch out" flags show when your size is close to a plan's daily limit.
Consistency rules can block a pass after you hit the target
Some plans say no single day can be more than a set share of your total profit, such as 40%. One big day can mean you have to keep trading after reaching the target. The calculator counts that, so a plan with this rule may show a lower pass chance or more days.
Minimum days, news, overnight and contract limits
Some plans make you trade a minimum number of days, so you can't pass faster than that. Others limit news trading, holding overnight or how many contracts you can trade. Tick the boxes under "More about how you trade" and the calculator drops or flags the plans that don't allow how you trade.
Extra trades don't make you better
More trades a day gets you to the target faster only if every trade is as good as your normal ones. Extra trades taken just to go faster are usually worse, and they make each day swing harder, so the daily limit gets hit more often. Put in the number of trades you really take on a normal day.
What percentage of traders pass prop firm challenges?
Most prop firms don't publish one. We only quote a pass rate a firm publishes on its own pages, and we haven't found one from the futures firms on this page. A firm-wide number would say little about you anyway, because it mixes good traders with brand-new ones.
Your own odds are what the calculator shows. They're your numbers run through each plan's real rules, not a guess about other traders.
What is the easiest prop firm to pass?
There isn't one easiest firm for everyone. The easiest plan is the one whose rules fit how you trade. Put your numbers in, and the top row is your easiest plan.
Easiest isn't always cheapest, though. Compare "cost at your pass rate", and check the True Cost Index for prices across all firms.
What is EV in a prop firm challenge?
EV means expected value. It asks one question: on average, do you get back more than you pay?
For a prop firm challenge, EV mixes two kinds of numbers. Some are facts about the plan: the price, the profit target, the max loss and the rules. Others are guesses about you: your win rate, your profit factor and how big you trade.
This calculator keeps those apart. The plan facts come from each firm's own pages. Your numbers come from you, and only you know if they're true.
Is a prop firm challenge worth it?
Yes, if what you'd pay to get funded at your pass rate is less than what a first payout would bring you. How often you'd pass matters more than the price. A cheap challenge you pass 1 time in 4 costs more than a pricier one you pass 1 time in 2.
Here's the math. If a challenge costs $100 with a code and you pass 1 in 4 tries, getting funded costs about $400. Add the activation fee once, if the plan has one.
That's why the list shows "cost at your pass rate" next to the price. Then "get paid back" tells you how often a first payout would cover that cost.
What is profit factor?
Profit factor is the money you won divided by the money you lost. If your winning trades made $3,000 and your losing trades lost $2,000, your profit factor is 1.5.
Above 1 means you made money overall. Exactly 1 means you broke even. Below 1 means you lost money.
Most trading journals show profit factor on the stats page. Use the number from many trades, not your best week.
What is a good win rate for a prop firm challenge?
There isn't one good win rate on its own. A 40% win rate with big winners can beat a 60% win rate with small ones.
What matters is win rate and profit factor together. The calculator turns them into one number first: what your average trade is worth. If that number is zero or less, no plan fits yet, and more days just means more blown accounts.
If your average trade is above zero, your risk size and the plan's rules decide the rest.
How much should you risk per trade on a challenge?
Less than you think, and the calculator shows why. Take a made-up trader with a 50% win rate and a profit factor of 1.5, taking 3 trades a day. On an example 50K plan with a $3,000 target, a $2,000 end-of-day max loss and a $1,000 daily limit, they pass about 80% of the time at $200 a trade. At $400 a trade, the same trader passes about 70% of the time and blows the account about 30% of the time.
Same skill, bigger size, worse odds. Smaller size can be slower, though. Use the "best size" line on each plan to see where your size is the best fit.
Also check your losing streak. Six losses in a row at $400 a trade is $2,400, which is more than that plan's whole max loss.
Is Prop Desk True Cost the same as EV?
No. Prop Desk True Cost is the bill: what the challenge costs with today's best code, plus any activation fee. It's the same for everyone.
EV is a guess about you, because it depends on how often you'd pass. This calculator starts with the bill, then runs your numbers on top. You can see how we work out the bill on our Method page.
How many trades do you need before your stats mean anything?
At least 50, and 100 or more is better, all from the same setup.
Here's why. Say your real win rate is 50%. Over just 20 trades, your journal could easily show anything from about 30% to 70% by luck alone. Over 100 trades, it would usually land between about 40% and 60%.
So if your stats come from a handful of trades, treat the results as a rough first look.