
ICT trading strategy: the short version
- ICT reads price around liquidity: stop orders resting above old highs and below old lows, which price often takes before it turns.
- The market maker model (MMXM) reduces to three beats: expansion, retracement, expansion. Entries come on the retracement, from an order, breaker or rejection block.
- The main ICT window, the New York morning, holds the 8:30 and 10:00 AM news releases. Of the 62 firms we track, 25 let you trade through news and 37 limit it in some way.
- Size the stop past the sweep against your daily loss limit. Micros let you keep the dollar risk steady when the stop distance changes.
- There is no verified win rate for ICT. It is a framework, and the firm's rules still decide whether a good trade keeps the account.
Education only, not financial advice. Trading futures involves substantial risk of loss. Prop Desk is not affiliated with ICT.
What is the ICT method of trading?
ICT stands for Inner Circle Trader. It is a body of free trading lessons that spread through YouTube over the last decade and gave day traders a shared vocabulary: liquidity, order blocks, fair value gaps, kill zones.
I trade off a market maker model framework myself. The pieces I actually use are liquidity sweeps, order blocks, breaker blocks and rejection blocks.
Steven T.
Strip away the names and the method says three things:
- Price is drawn to liquidity. Stop orders pile up above old highs and below old lows. Those pools are targets.
- Moves often start with a fake. Price runs one way to take those stops, then turns and travels the other way.
- Time matters as much as price. The same pattern means more at 9:45 AM New York time than at lunch.
Why prop firm traders use ICT concepts
A prop evaluation rewards exactly what ICT setups promise: small defined risk, a clear target, and one or two trades in a short window instead of all-day screen time. A stop that sits just past a swept high is easy to size against a daily loss limit.
That fit is why the method took over funded-trader chat rooms.
One caution before going further. Nobody can prove from a chart who caused a move. "Smart money" is a story that helps traders organize what they see.
Treat the concepts as a map for where orders probably sit, not as inside knowledge.
What is MMXM? The ICT market maker model
MMXM is shorthand for the two market maker models. The buy model (MMBM) ends in a move up. The sell model (MMSM) ends in a move down.
The X just means either one. It is the frame that ties every other ICT idea together, because it tells you where you are in the story before you look for an entry.
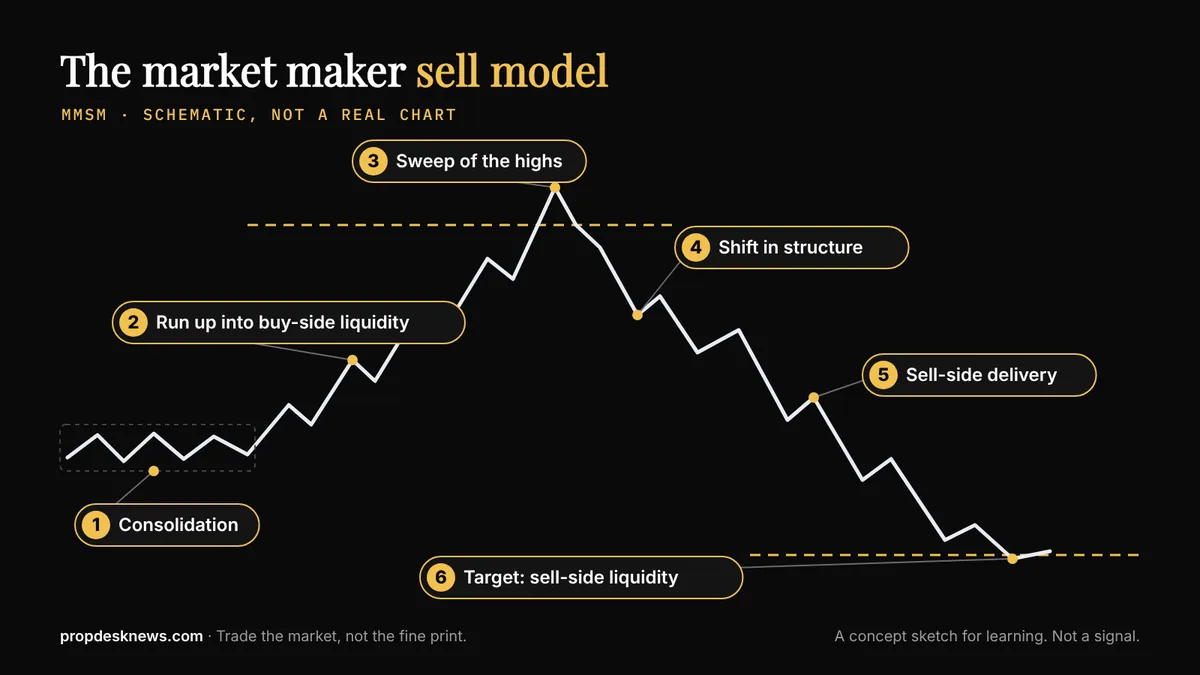
The MMXM model: six stages
Using the sell model as the example:
- Consolidation. Price ranges and builds orders on both sides.
- The run toward liquidity. Price climbs in steps toward a pool of buy stops above old highs. Each pause on the way up leaves a small footprint that matters later.
- The sweep. Price pushes through the highs, triggers the stops and fills the large sell orders that needed those buyers.
- The shift in structure. Price breaks back below the last small low with force. This is the first evidence the run is over.
- Delivery. Price walks back down through the earlier pauses, often retracing into a block or gap first. This is where most entries happen.
- The target. The move aims at the sell-side liquidity resting below the original range.
The buy model is the mirror image: a run down into sell stops, a sweep of the lows, a shift up, and delivery toward the highs.
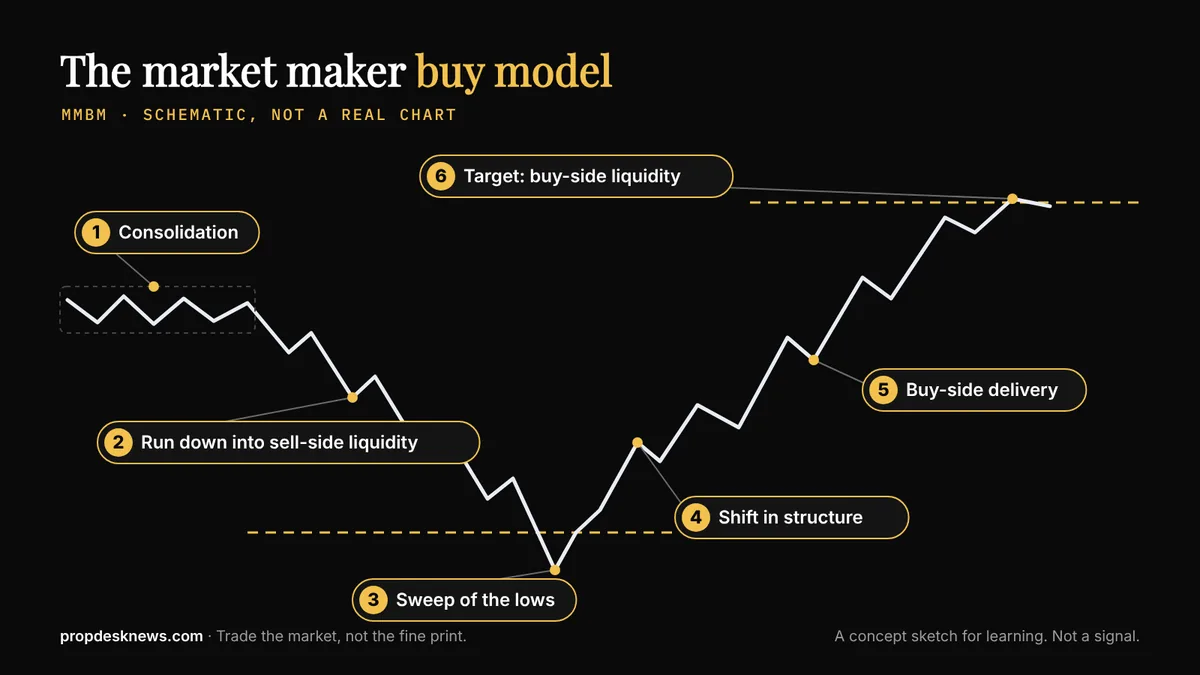
ICT MMXM strategy, simplified: expansion, retracement, expansion
Six stages is a lot to hold in your head with a live chart moving. The whole model reduces to a three-beat rhythm that repeats at every size.
- Expansion. Price leaves an area fast and in one direction. It breaks structure and leaves blocks and gaps behind it.
- Retracement. Price drifts back, slower, into one of those blocks or gaps. This is where entries are taken.
- Expansion. Price leaves again in the same direction and travels toward the liquidity target.
In the sell model, the first expansion is the drop that breaks structure after the sweep. The retracement is the climb back into the breaker or order block. The second expansion is the delivery down to the target.
If you can't tell which of the three beats price is in, you don't have a trade yet.
I think of market maker models in the context of expansion, retracement, expansion.
Steven T.
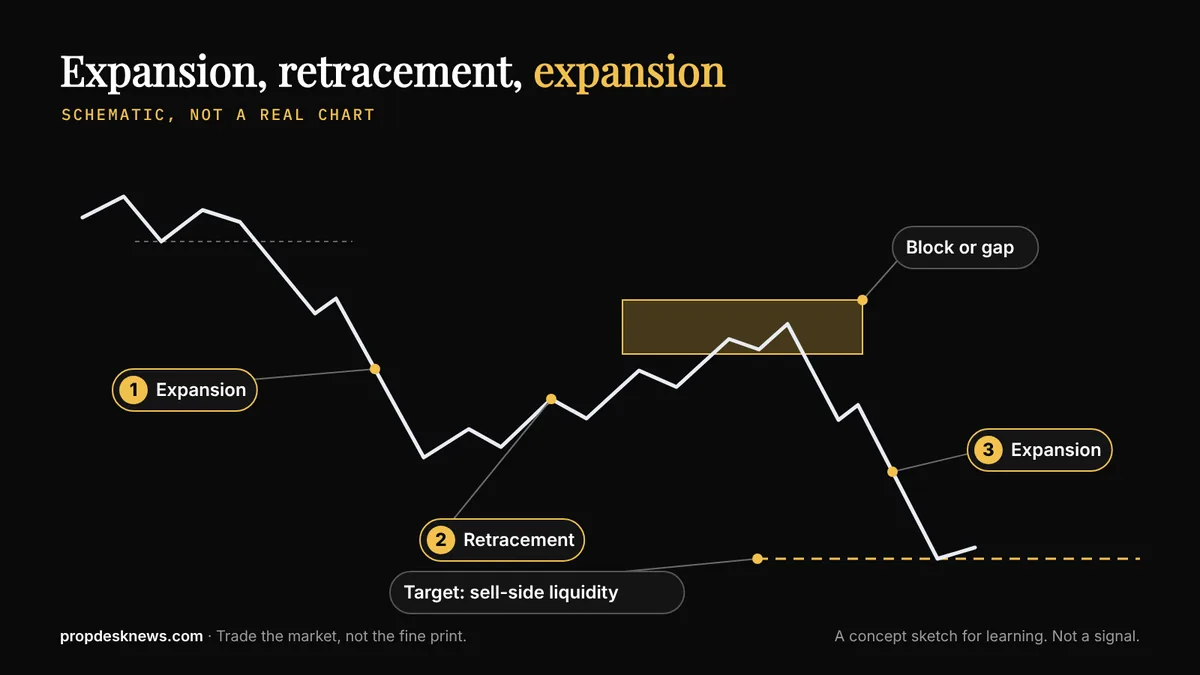
It's fractal: big models hold smaller ones. The model is not tied to one chart. A sell model on the 4-hour chart can take days to play out, and each leg of it is built from smaller buy and sell models on the 5-minute and 1-minute charts.
Traders use the higher timeframe to decide direction and the lower timeframe to find the entry.
It's a framework that spans everything up to the higher timeframes, because everything is fractal. Within larger MMXMs, you have lower timeframe ones.
Steven T.
ICT MMXM timeframe alignment
Because the model repeats at every size, each higher timeframe has a lower timeframe that fits it. The higher one gives the read. The lower one gives the entry.
| Read the model on | Enter on |
|---|---|
| Daily | 1-hour |
| 4-hour | 15-minute |
| 1-hour | 5-minute |
| 15-minute | 1-minute |
| 5-minute | 15 or 30 seconds |
Since price is fractal, you have to use timeframe alignment. For the daily, I use the 1-hour. For the 4-hour, the 15-minute.
For the 1-hour, the 5-minute. For the 15-minute, the 1-minute. Even from the 5-minute you can drop to a 15 or 30 second chart, because the framework appears on all timeframes.
Steven T.
What the model can't tell you. It can't tell you which high gets swept, or whether a sweep will reverse or keep running. Plenty of sweeps are simply breakouts.
The model gives you a script to compare price against, and a clear point where the script is wrong. That second part is what makes it usable on a funded account.
What is a liquidity sweep?
A liquidity sweep is a quick push through an obvious high or low that triggers the stop orders resting there, followed by a close back inside the old range. Buy stops sit above highs. Sell stops sit below lows.
The sweep is the market collecting them.
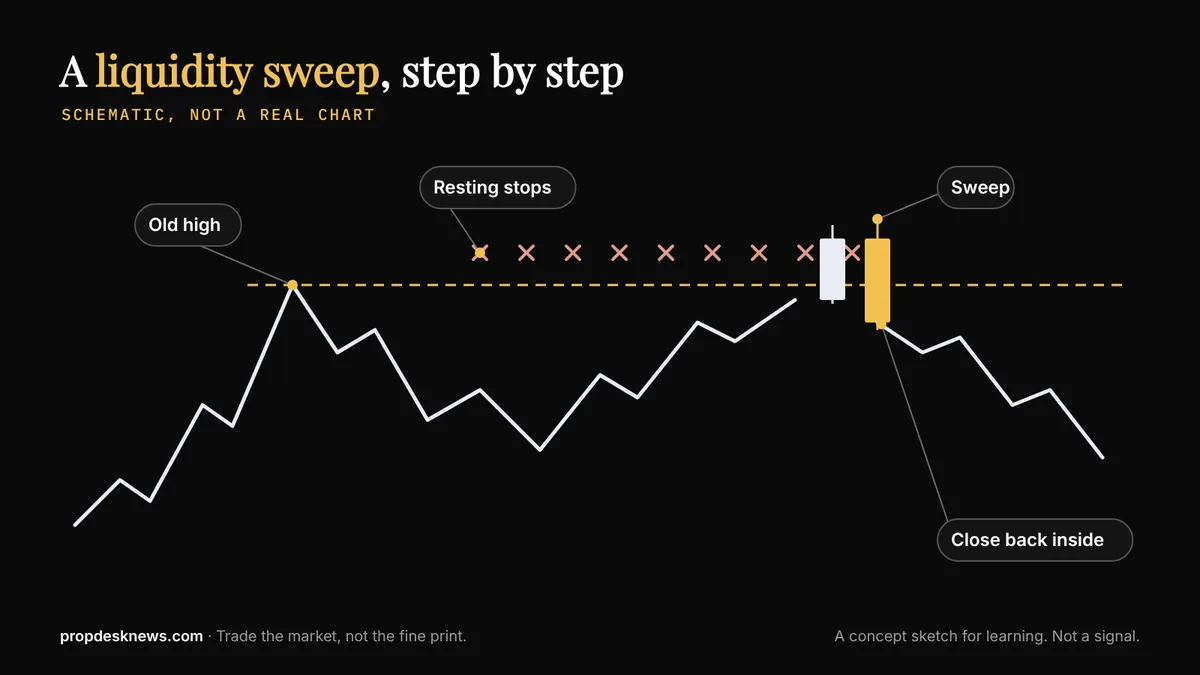
ICT liquidity sweep, explained: where stops cluster
- The previous day's high and low
- The overnight and London session high and low
- Equal highs or equal lows, where price turned at the same level twice
- The high or low of the first minutes after the 9:30 AM open
Liquidity sweep vs liquidity grab
In practice, traders use the words loosely. Where a line is drawn, a grab is a single quick wick through the level and straight back, and a sweep is a slightly longer push that takes out a cluster of levels before turning.
Both describe the same event, stops being run, and both are traded the same way.
ICT liquidity sweep strategy: a sweep is not an entry
This is the most expensive beginner mistake. Price pokes above a high, a new trader shorts immediately, and price keeps going. The sweep is only stage three of the model.
The entry needs stage four as well: a decisive break back through structure, then a return to a block or gap. No shift, no trade.
What is SMT divergence?
SMT divergence is when two markets that usually move together stop agreeing. One makes a new high or low and the other does not.
NQ and ES usually move together. SMT is ICT's name for a crack in that correlation: one market makes a new high or low and the other one fails to. When that crack shows up right at a level that matters, it is a sign the push through the level may not hold.
I mark my higher-timeframe levels in the morning. Then I look for a crack in correlation, otherwise known as SMT, at the higher-timeframe level I'm anticipating a rejection from.
The strongest liquidity sweeps are when a swing high or swing low gets taken into your point of interest, whether that's an order block, a rejection block, or another higher-timeframe high or low.
Steven T.
ICT order blocks, breaker blocks and rejection blocks
Blocks are the zones ICT traders enter from. All three mark a place where price turned hard, and all three are used the same way: wait for price to come back to the zone, then trade in the direction of the original turn.
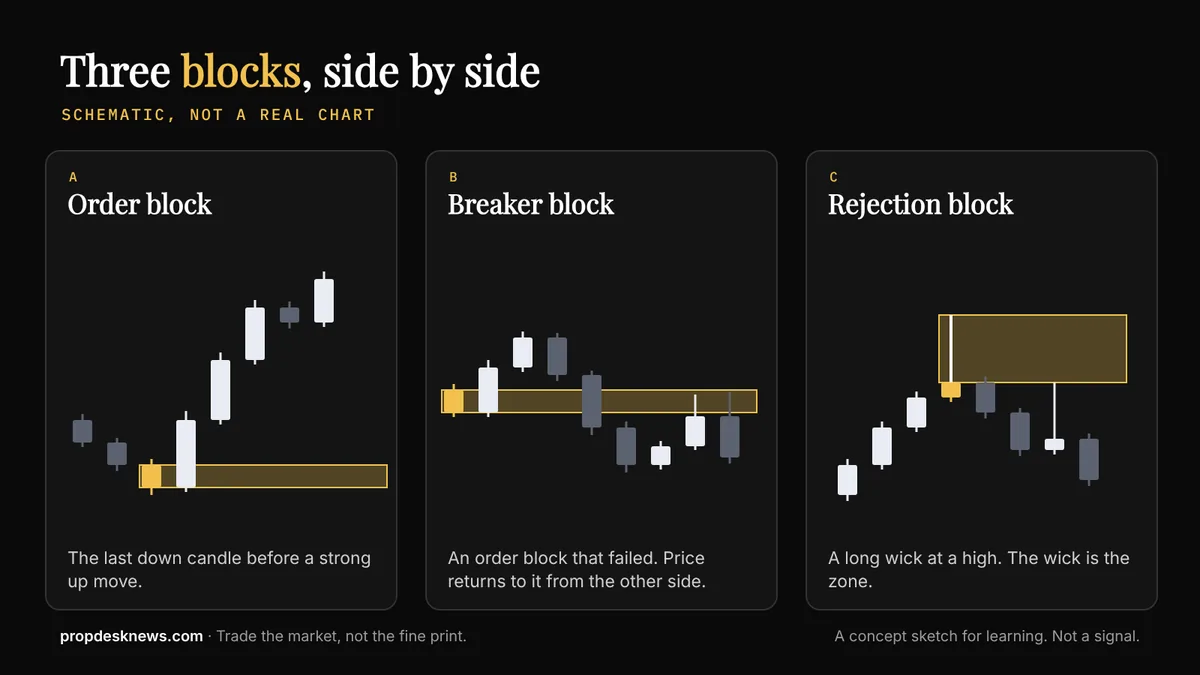
| Block | What it is | Where it forms | Common mistake |
|---|---|---|---|
| Order block | The last opposite candle before a strong move. For a rally, the last down candle. | At the origin of a move that broke structure | Marking every down candle. Without a strong move away, it is just a candle. |
| Breaker block | An order block that failed. Price broke through it, and the zone now works from the other side. | Right after a sweep and a shift in structure | Calling it a breaker before price has actually closed through the zone. |
| Rejection block | The wick zone at a swing high or low, from the candle body to the tip of the wick. | At a turning point with a long wick, often the sweep candle itself | Using it alone. It is a fine-tuning tool for entries, not a full setup. |
Order block vs breaker block
The short version: an order block is a zone that held, and a breaker is a zone that broke. In a sell model, the last up candle before the sweep high may act as an order block on the way up.
Once price reverses and closes below it, the same zone becomes a bearish breaker.
If price climbs back to it, sellers are expected there.
What is a rejection block?
A rejection block is an entry zone drawn from only the wick of the candle at a turning point.
Order blocks can be wide, and a wide zone means a wide stop. A rejection block uses only the wick, so it gives a tighter entry at the same turning point. On a prop account with a small daily loss limit, that tighter stop is often the difference between one contract and two.
Breaker block vs mitigation block
Both are zones that failed and now work from the other side. The difference is what price did just before the failure.
- Breaker block. Price swept the earlier high first, then broke down.
- Mitigation block. Price failed to reach the earlier high, made a lower high, then broke down.
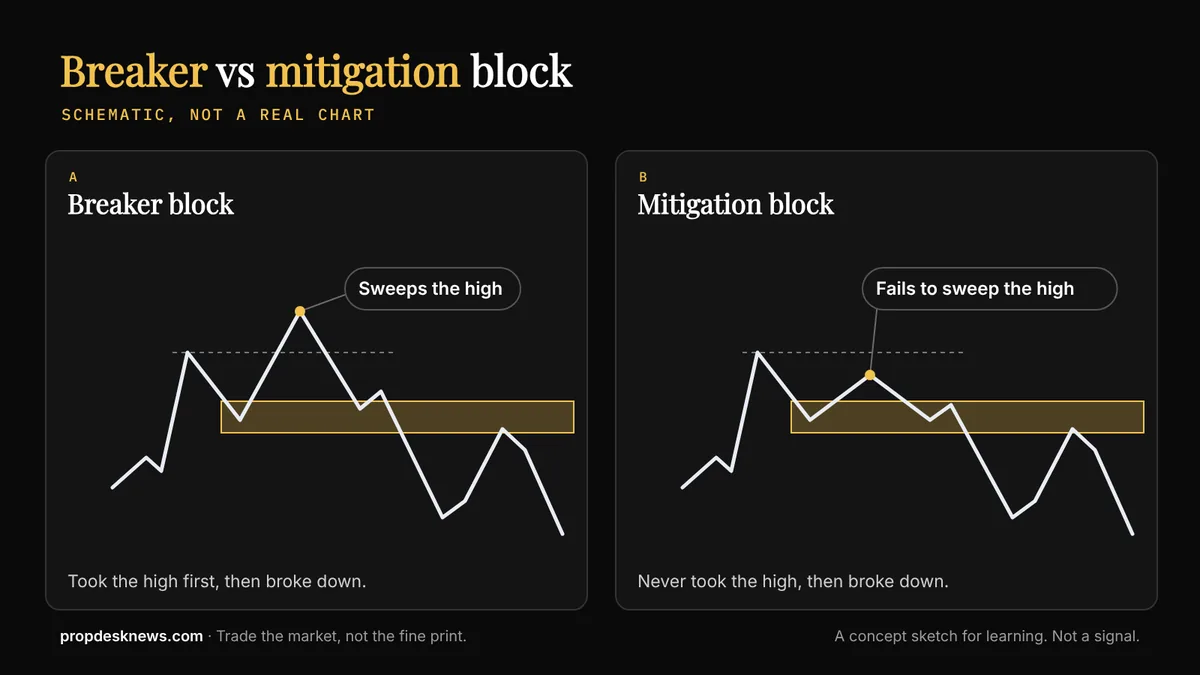
The breaker block sweeps the high. The mitigation block fails to sweep the high. That gives extra context too, because that failure is the SMT we want to see.
Steven T.
ICT order block strategy: which block to enter from
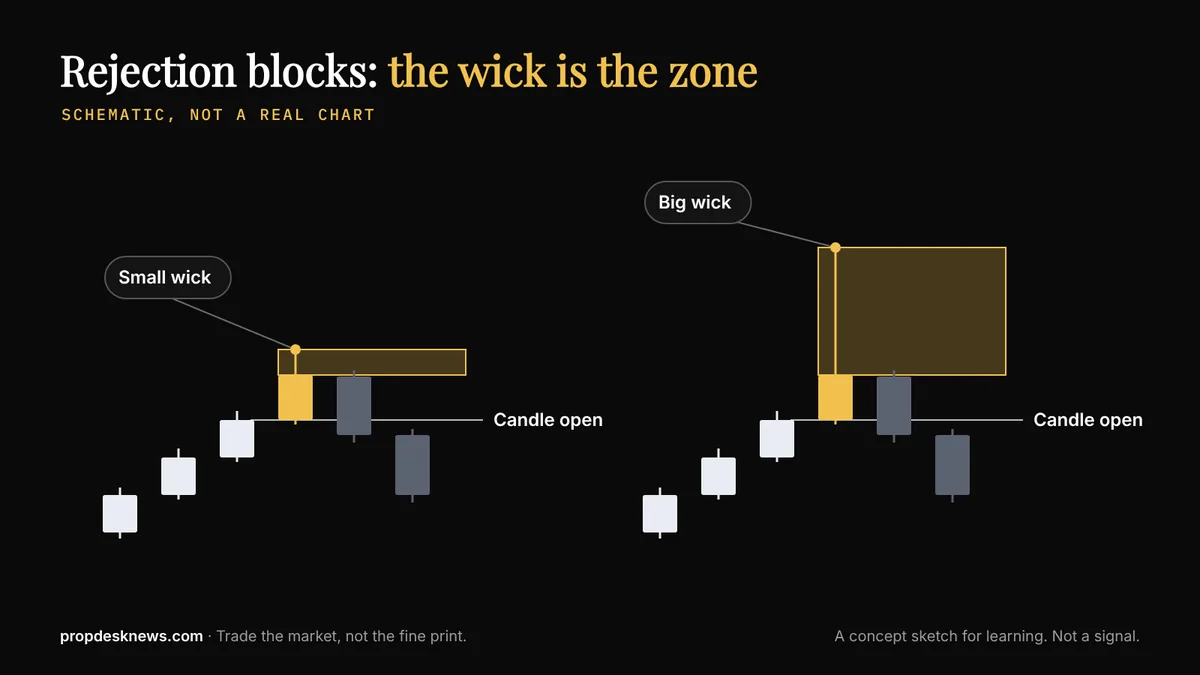
Usually, the bigger the wick, the stronger the rejection block. The opening price of that candle should act as a strong place where buyers or sellers are located.
That's why I prefer higher-timeframe rejection blocks over the other two, and they offer the most risk to reward. My ideal entry is at the rejection block. Next is the order block.
After that, the breaker or mitigation block.
Steven T.
ICT fair value gaps and the PD array matrix
ICT groups all of these reference points into one ordered list called the PD array matrix. PD stands for premium and discount. Above the middle of a range, price is at a premium and traders look for sells.
Below the middle, price is at a discount and traders look for buys. The commonly taught order, from the edge of the range inward, is: old high or low, rejection block, order block, fair value gap, liquidity void, breaker block, mitigation block.
A fair value gap is a three-candle pattern where a fast move leaves a gap between the first and third candle. Many traders enter inside the gap. It can also be read a second way: as proof that price left a level with force.
I stopped using fair value gaps as entries. Now I only use them as information that price displaced from a higher-timeframe level. I'd rather enter from a rejection block, order block or breaker, because you can use that candle's opening price as your higher-timeframe level.
Steven T.
ICT liquidity sweep example: ES and NQ on the 4-hour chart
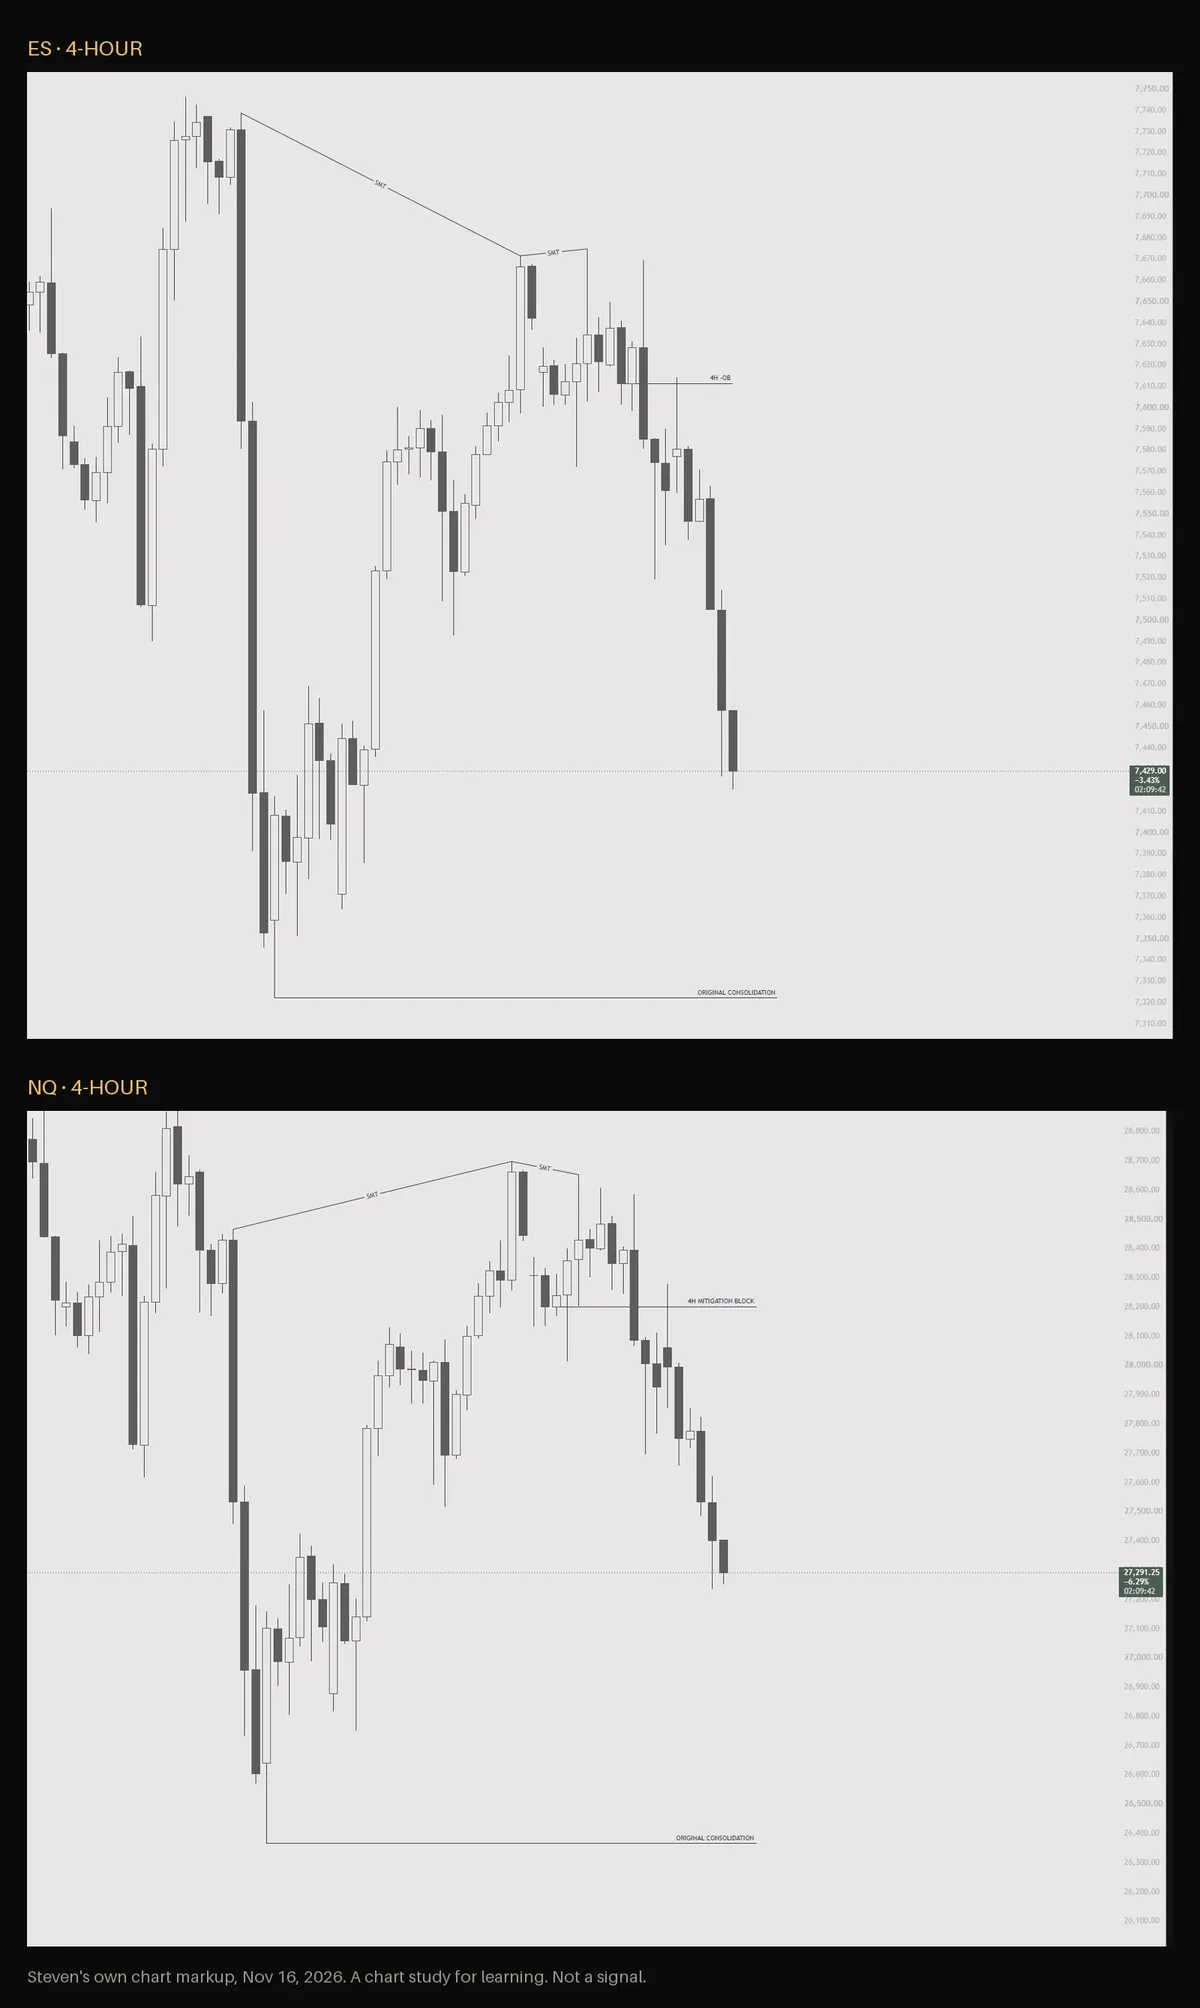
It's an order block on ES because that 4-hour candle made the liquidity sweep you can see on the ES chart. NQ was the weaker asset. It never took its high, so on NQ the zone is a mitigation block, and that's where the change in state of delivery showed up.
Steven T.
A change in state of delivery, often shortened to CISD, is ICT's term for the moment price closes back through the open of the candles that carried the last move. Buyers were delivering price up, and now sellers are delivering it down.
Here it appeared on the weaker market first, which is the same lesson as the breaker and mitigation diagram above: the market that fails to take its high is the one telling you the turn is real.
Targets: the original consolidation first, then a higher-timeframe level.
The original consolidation is the first target. You want a higher-timeframe target below it as well. A market maker model is stronger if it pauses before it reaches a higher-timeframe level.
If price consolidates and retraces before it gets to its draw on liquidity, think of it as expansion, retracement, expansion: that pause is the retracement leg before price expands back down.
So I'd potentially take a partial at the original consolidation and take the full position off at the higher-timeframe level.
Steven T.
Taking a partial at the first target also suits a prop account. It banks some of the open profit before a trailing drawdown can count it against you, which is covered in the rules section below.
ICT kill zones, NY AM and the silver bullet
ICT sets every time in New York time. Kill zones are the hours when volume shows up and sweeps tend to happen. Sources differ slightly on the edges, so treat these as the commonly taught windows.
| Window | New York time | What traders watch for |
|---|---|---|
| Asian range | 8:00 PM to 12:00 AM | Builds the overnight high and low that later sessions target |
| London kill zone | 2:00 to 5:00 AM | First sweep of the overnight range |
| New York AM kill zone | 7:00 to 10:00 AM | The main window for index futures. Some teachers run it to 11:00. |
| Silver bullet (AM) | 10:00 to 11:00 AM | A one-hour window for a single fair value gap entry |
| New York PM | 1:30 to 4:00 PM | Afternoon continuation or reversal. Includes the 2:00 to 3:00 PM silver bullet. |
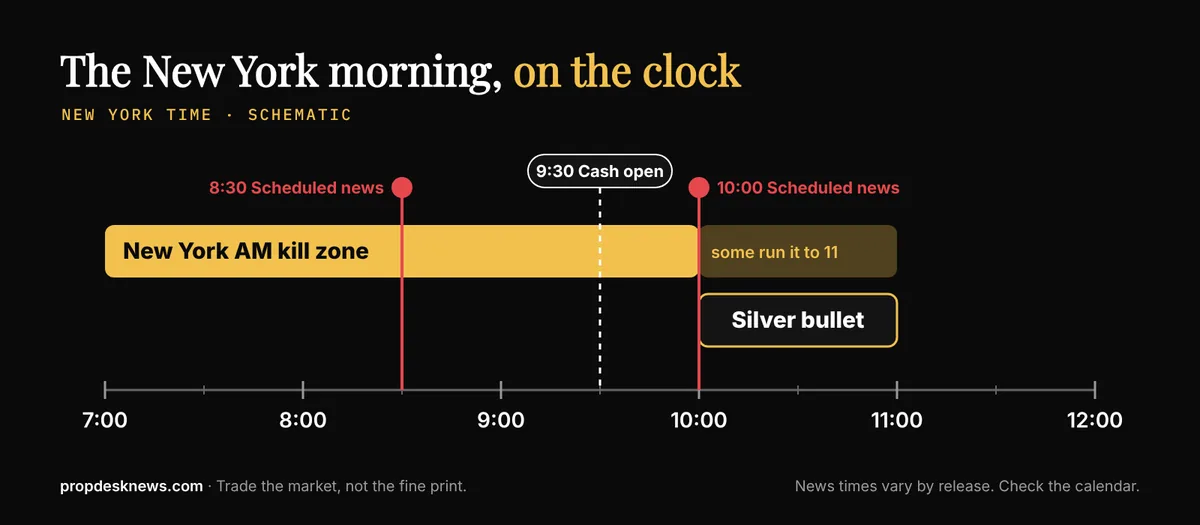
Why NY AM collides with the news. Most major US economic reports land at 8:30 AM New York time, including CPI and the monthly jobs report. Others land at 10:00 AM.
Both times sit inside the New York AM window, and the 10:00 release opens the silver bullet hour.
So the hours ICT tells you to trade are the same hours many prop firms tell you to be careful, or flat.
I don't have specific windows that I will or won't trade. When the model presents itself, it presents itself. A big part of trading is understanding that when your model shows up, you execute.
Risk management matters because how much you risk is all you can control. You don't know for certain whether the market is going up or down. You use your edge and let it play out over time.
Steven T.
ICT trading on a prop firm: the rules that matter
This is the part most ICT guides skip. A setup can be perfect and still cost you the account, because a funded account has rules a personal account doesn't.
Prop firm news trading rules
Of the 62 firms we track, 25 let you trade through news and 37 limit it in some way. The limits come in three shapes: a flat window where you can hold no position, a no-new-orders window, or a rule that removes profit made near the release.
Evaluations are often free, and the limit starts once you are funded. Each firm's wording is on our news trading rules page.
| Firm | News | The rule, in one line |
|---|---|---|
| Alpha Futures | Limited | Evaluations and Advanced: no limit. Other funded accounts: no orders 2 minutes either side. Source ↗ |
| Blue Guardian | Allowed | Allowed on Elite, Reserve, Express and Direct; evaluation only on Zero. Our rules page → |
| Funded Futures Network | Limited | Fine in evaluations. Funded: flat from 1 minute before to 1 minute after Tier 1 news. Source ↗ |
| FundedNext Futures | Allowed | Allowed on standard accounts; some promo accounts ban it. Source ↗ |
| IQ Capital | Allowed | No extra limits around news. Source ↗ |
| Phidias Propfirm | Allowed | Allowed on every account. Source ↗ |
| The Trading Pit | Allowed | Allowed on both futures accounts. Our rules page → |
| Top One Futures | Limited | Funded: no trades from 2 minutes before to 2 minutes after high-impact news. Source ↗ |
| TradeDay | Limited | Positions are closed 2 minutes before Tier 1 releases; trading reopens 2 minutes after. Source ↗ |
| Apex | Limited | Allowed; no orders on both sides to gamble on the release. Source ↗ |
| Atlas Funded | Limited | No limit on Standard, Apex or Direct; funded Atlas Daily has a 1-minute window. Source ↗ |
| Blueberry Futures | Limited | No new orders 3 minutes either side of high-impact news; profit from those trades is deducted. Source ↗ |
| BluSky Trading | Allowed | Allowed, at your own risk. Our rules page → |
| Bulenox | Allowed | No blackout windows. Source ↗ |
| DayTraders.com | Allowed | Allowed, though not recommended. Our rules page → |
| Earn2Trade | Allowed | No restrictions around economic announcements. Source ↗ |
| Elite Trader Funding | Allowed | No restrictions during major economic news. Source ↗ |
| FTUK | Allowed | Allowed. Source ↗ |
| Funded Family One | Allowed | Allowed unless your plan says otherwise. Source ↗ |
| FuturesElite | Limited | Tier-1 news allowed in evaluations; funded trades in a restricted window are voided. Source ↗ |
| Goat Funded Futures | Limited | EOD, 1-Day-Pass and Flex evaluations: no limit. Funded: no orders 2 minutes either side. Source ↗ |
| Hola Prime | Allowed | Allowed. Source ↗ |
| Lucid | Limited | Allowed, except on LucidDaily funded accounts, where high-impact US news is a hard breach. Source ↗ |
| MFFU | Limited | Evaluation: allowed. Funded: flat from 2 minutes before to 2 minutes after Tier 1 data. Source ↗ |
| OneUp Trader | Limited | Evaluation: allowed. Funded: flat before and during major economic releases. Source ↗ |
| Purdia Capital | Allowed | Not restricted on simulated accounts. Source ↗ |
| Take Profit Trader | Limited | PRO: flat from 1 minute before to 1 minute after FOMC, NFP and CPI. Source ↗ |
| The Futures Desk | Allowed | Allowed. Source ↗ |
| Topstep | Limited | A short restricted window around Tier 1 news; no full size into a major release. Source ↗ |
| Tradeify | Allowed | No restrictions; Tier 1 news allowed. Source ↗ |
30 futures firms, read from each firm's own rules pages, checked Nov 3 to Nov 14, 2026. "Limited" also covers rules that change by plan or once you are funded.
Firms where Prop Desk has a code list first, then A to Z; a code never changes a reading. Check any firm against how you trade with the trading style checker.
When you're trading futures firms intraday, sometimes the news rule will bite you, and sometimes you have to wait outside of that timeframe.
Steven T.
Slippage on news can blow past your stop. Even where news trading is allowed, a stop order is not a guarantee. On a fast release, price can jump over your stop level and fill you well beyond it.
A planned $200 loss becomes $350, and on a prop account that extra counts against your daily loss limit and your drawdown just the same.
It might not even be because of a rule. High-impact news can slip your stop loss, and you end up losing more than you anticipated.
Steven T.
What is a Judas swing? How I handle a news morning
One more term first. The Judas swing is ICT's name for the false move at the start of a session, the manipulation leg that runs stops before the real move begins.
On news mornings I'm usually flat before high-impact news, and then I see what the news did. You can treat high-impact news as either the manipulation or the distribution.
If 8:30 manipulates, you might expect a small consolidation after it, and then 9:30 distributes toward the draw on liquidity. Same thing for the 9:30 open: it generally provides the Judas swing, the manipulation, before distributing to the draw on liquidity.
I try to let the first 5 to 15 minutes digest before hunting for setups, especially after 9:30.
Steven T.
That habit lines up well with the rules. Waiting 5 to 15 minutes keeps you outside the 1 and 2 minute windows in the table above, and it lets the worst of the slippage pass.
Daily loss limit vs a stop past the sweep. ICT stops go beyond the sweep high or low. Sometimes that is 8 points away and sometimes 30. The daily loss limit doesn't care how good the setup is.
Before entering, check that the full stop distance, times your size, fits inside what you have left for the day with room for a second attempt.
If it doesn't, the answer is fewer contracts, not a closer stop inside the sweep.
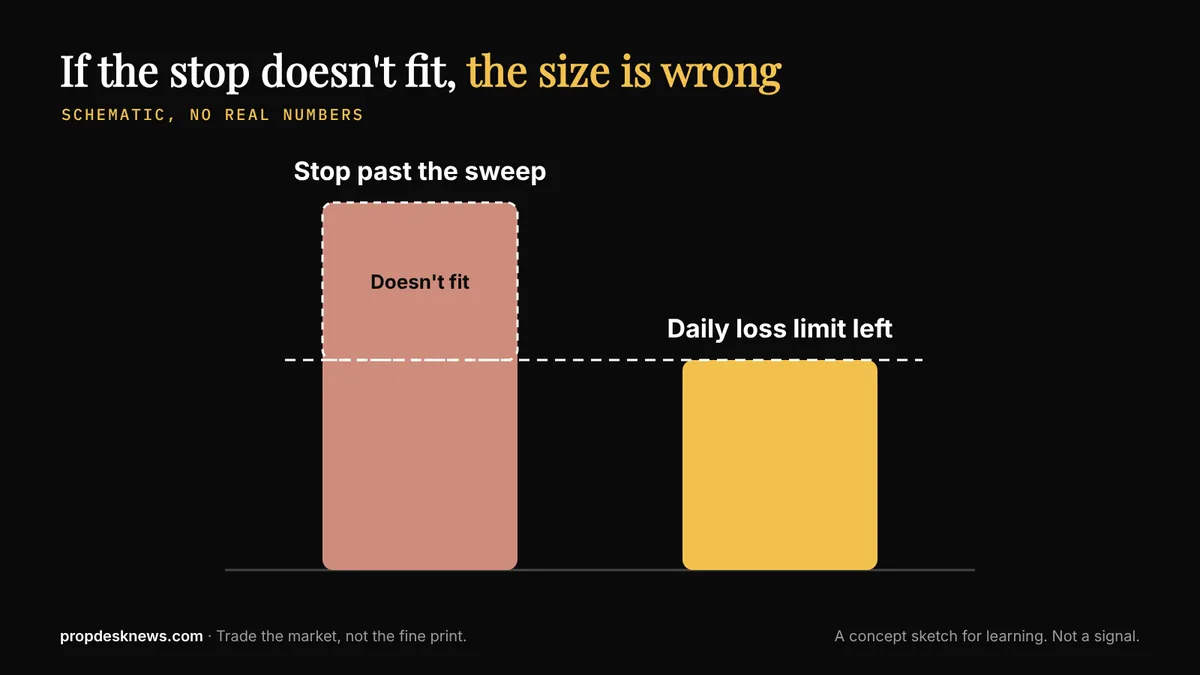
How trailing drawdown works with wide targets
ICT targets are far away by design: the opposite pool of liquidity. On an account where the drawdown trails your highest open profit, a trade that runs most of the way to target and then comes back to break-even still drags the drawdown line up behind it.
You made nothing and lost room. Traders on intraday trailing accounts often take partial profit at the first opposing block for this reason. End-of-day drawdown accounts are more forgiving to the full-target style.
The Drawdown Lab shows how each type moves and which firms use which.
Prop firm consistency rule and one big NY AM day
A clean model can deliver a week's profit in one morning. Many firms cap how much of your total profit can come from a single day, in the evaluation, at payout, or both.
Say the cap is 50% and your best day made $1,500. You now need at least $3,000 in total profit before that day stops being a problem. Check the number with the consistency calculator before you let a runner go.
Prop firm copy trading rules for one setup on several accounts
One ICT entry copied across five accounts multiplies everything above. A slipped stop slips five times. If you run a copier, read each firm's copy trading and multiple account rules first, because some allow it only between your own accounts and some cap the count.
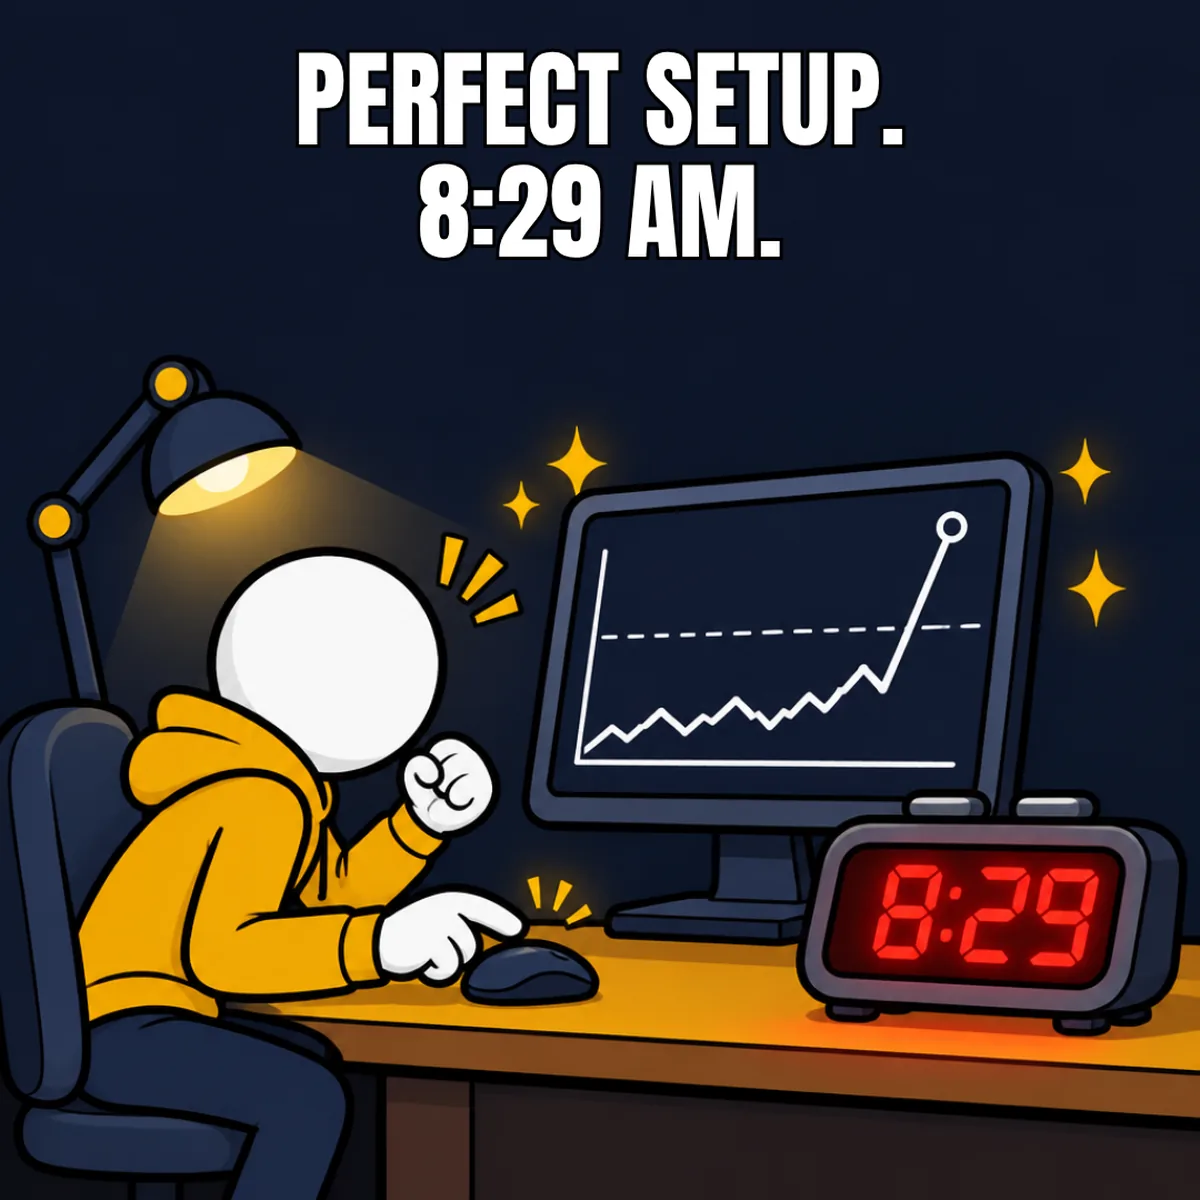
Transcript
Your setup is perfect. It's 8:29.
Most big U.S. reports, like CPI and the jobs report, come out at 8:30, New York time. Others land at 10.
Both times sit inside the New York morning window that ICT traders use most.
Of the 62 prop firms we track, 37 limit news trading in some way. 25 allow it.
On funded futures accounts, the usual limit is a short window, often one or two minutes either side of the release. You have to be flat, or you can't place orders. Evaluations are often free of it.
Even where news is allowed, a stop can slip on a fast release. The loss is bigger than you planned, and it still counts against your daily loss limit.
Before the click, check the calendar. Then check your firm's news rule.
ICT on NQ and ES futures: micros vs minis
The setup decides where the stop goes. The account decides how much that stop can cost. Contract choice is how you make the two agree.
| Contract | Per tick | Per point | 20-point stop |
|---|---|---|---|
| NQ (E-mini Nasdaq-100) | $5.00 | $20 | $400 |
| MNQ (Micro Nasdaq-100) | $0.50 | $2 | $40 |
| ES (E-mini S&P 500) | $12.50 | $50 | $1,000 |
| MES (Micro S&P 500) | $1.25 | $5 | $100 |
Tick values from CME contract specs. Full list on the tick value cheat sheet.
A micro is one tenth of the mini. That matters for ICT because stop distance changes with every setup.
With micros you can keep the dollar risk steady: 5 MNQ on a 20-point stop risks $200, and 10 MNQ on a 10-point stop risks the same $200. With one NQ, your only choices are $400 or nothing.
I read the full-size chart and send my orders on the micro.
Steven T.
NQ or ES? The two index contracts give the same setups most days, so the choice comes down to risk and to which one is behaving better.
I trade both. It depends on my risk. If NQ has a wider stop, I might have to use ES, because the risk would be too high on a prop firm account.
I also use whichever asset is stronger or weaker in the direction I want to trade.
If I'm looking for upside and one asset fails to make a lower low, I assume that's the stronger one and trade it. Vice versa for downside.
Steven T.
ICT vs SMC: which is better?
Neither is better. SMC is a simpler version of ICT, so if you learn one you can read the other.
SMC, short for smart money concepts, is the simplified offshoot of ICT. It keeps most of the price ideas: liquidity, order blocks, fair value gaps, breaks of structure.
It mostly drops the time rules, such as kill zones and the silver bullet windows, and it renames a few things.
If you learn one, you can read the other. The practical difference is that an ICT trader will pass on a good-looking pattern at the wrong time of day, and an SMC trader usually won't.
Does the ICT trading strategy work?
There is no verified win rate for ICT, and anyone quoting one is guessing or selling. The concepts are discretionary, so two traders can mark the same chart differently and get opposite results.
What can be said honestly:
- The method gives defined risk and a clear invalidation, which is what a prop account needs.
- Most prop evaluations are not passed, whatever the method. Our pass rate guide has the numbers firms have published.
- Traders who do well with ICT tend to trade one model, one session and one market, and journal every trade.
I like ICT because it gave me a framework, a way to contextualize and visualize the market through a lens that makes sense to me. The way it breaks things down, and the lingo it uses, lets me give context to what's happening on the chart.
That's why I think any strategy can work. It depends on you as a trader and what makes sense to you.
Steven T.
ICT trading strategy checklist for prop traders
- Are my higher-timeframe levels marked?
- Am I trading with the higher-timeframe order flow?
- Has liquidity actually been taken into my point of interest, with a close back inside?
- Is there a shift in structure and a block to trade from?
- Is there scheduled news in the next 15 minutes, and what does this firm's rule say?
- Does the stop, at this size, fit my daily loss limit with room to spare?
- If this trade hits target, does it break a consistency cap?
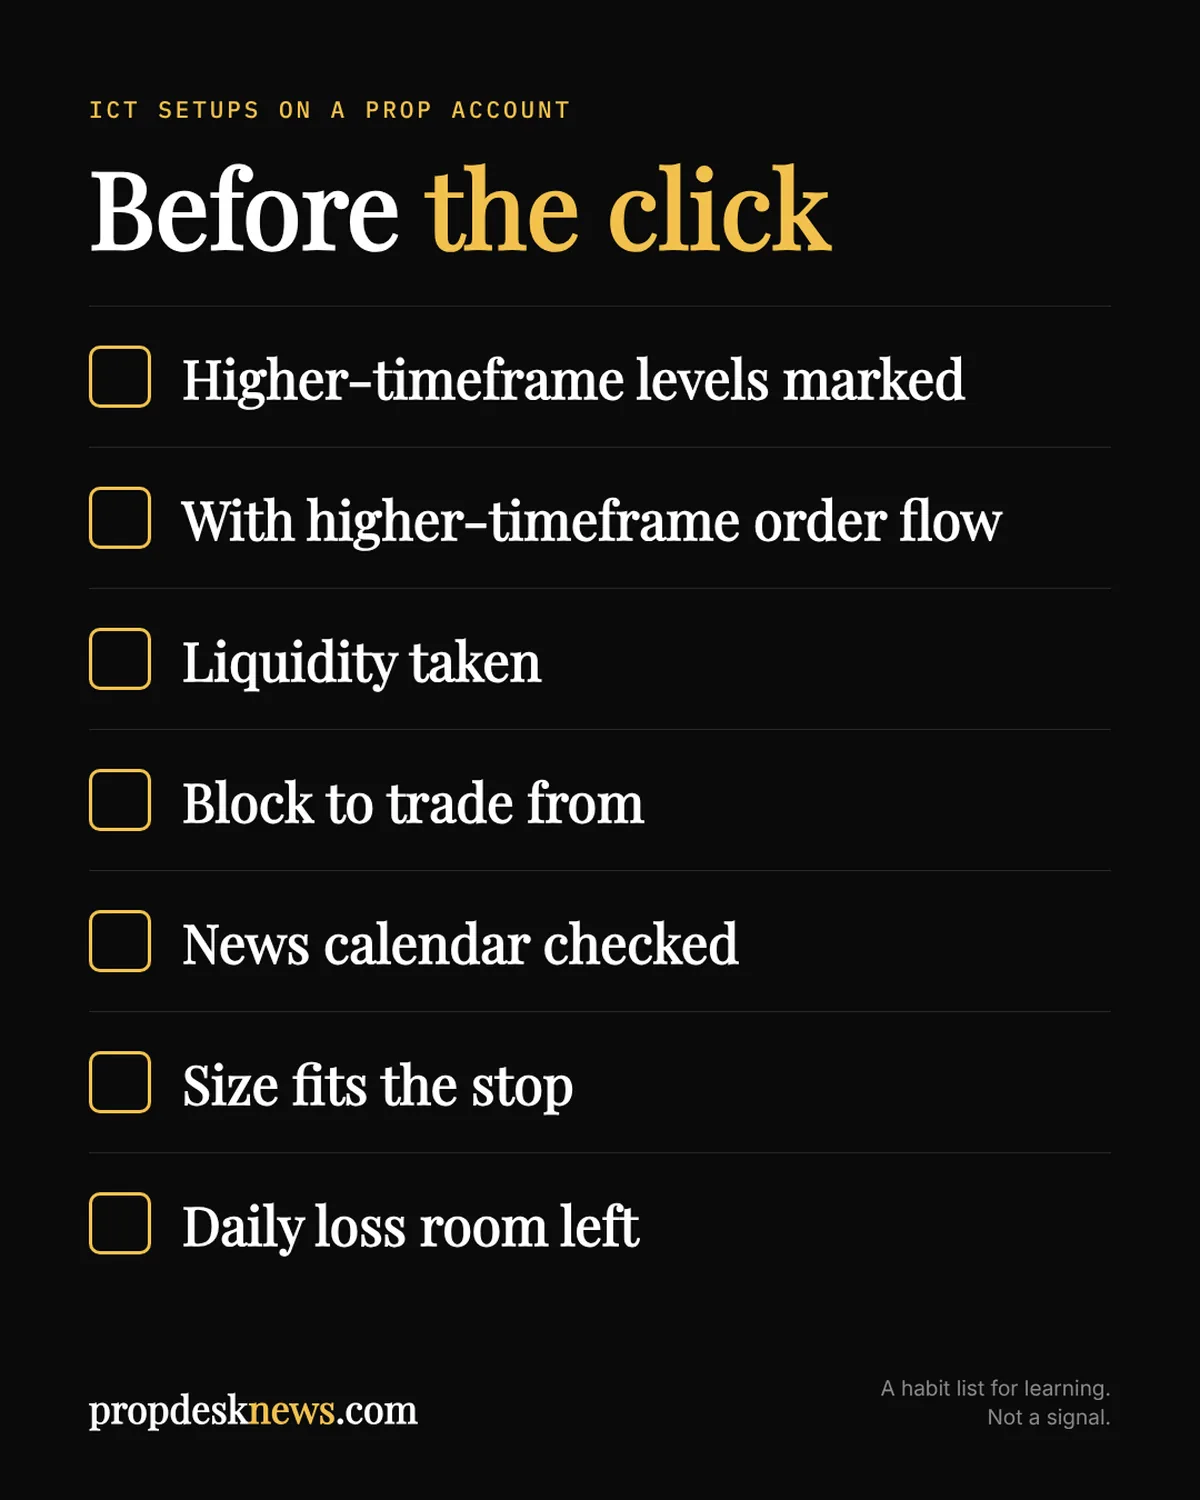
The model is a market maker model, but you want to mark your higher-timeframe levels and trade with the higher-timeframe order flow. Those are the most important things.
Steven T.
For the steps before the open, see the pre-market checklist and the 1% rule.
ICT trading questions
Can you use ICT on a prop firm account?
Yes. No firm we track bans ICT concepts. What firms restrict is behavior, such as trading inside news windows, holding overnight or very short scalps.
Check those rules against how you trade.
What time is the ICT New York kill zone?
Most guides give 7:00 to 10:00 AM New York time, and some extend it to 11:00 AM. For index futures, activity picks up at the 8:30 AM reports and the 9:30 AM cash open.
What are the ICT silver bullet times?
Three one-hour windows in New York time: 3:00 to 4:00 AM, 10:00 to 11:00 AM and 2:00 to 3:00 PM.
What does MMXM mean?
Market maker model, either direction. MMBM is the buy model and MMSM is the sell model.
What is the difference between an order block and a breaker block?
An order block is the last opposite candle before a strong move, and price is expected to respect it. A breaker is an order block that price broke through, so it now acts from the other side.
Does ICT work on futures?
The concepts apply to any liquid market. Index futures such as NQ and ES are popular because they move cleanly during the New York morning, and micros make position sizing flexible.
What timeframe is best for ICT?
There isn't one. Most traders take direction from a higher timeframe, such as the daily, 4-hour or 1-hour, and enter on the 5-minute or lower.
Which ICT strategy is most profitable?
Nobody can show you. There is no verified win rate for any ICT model, including the silver bullet. Pick the one model you can read on your own chart, test it on your own trades, and judge it by your numbers.
Sources
Read on Nov 16, 2026:
Show all 5 sources
Spot something out of date? Email hello@propdesknews.com and we'll fix it.
Related guides

Pre-market trading checklist for futures traders
12 steps before the open, risk first. Free printable PDF.
Updated Nov 12, 2026

The 1% rule in trading, with real futures numbers
1% of $50K is $500 a trade. On a 50K prop account, that is a quarter of the drawdown.
Updated Nov 12, 2026

Prop firm pass rates: what firms actually publish
Every pass rate a firm has published, what each one counts, and how many funded traders go on to get paid.
Updated Nov 11, 2026